 Routix Dash
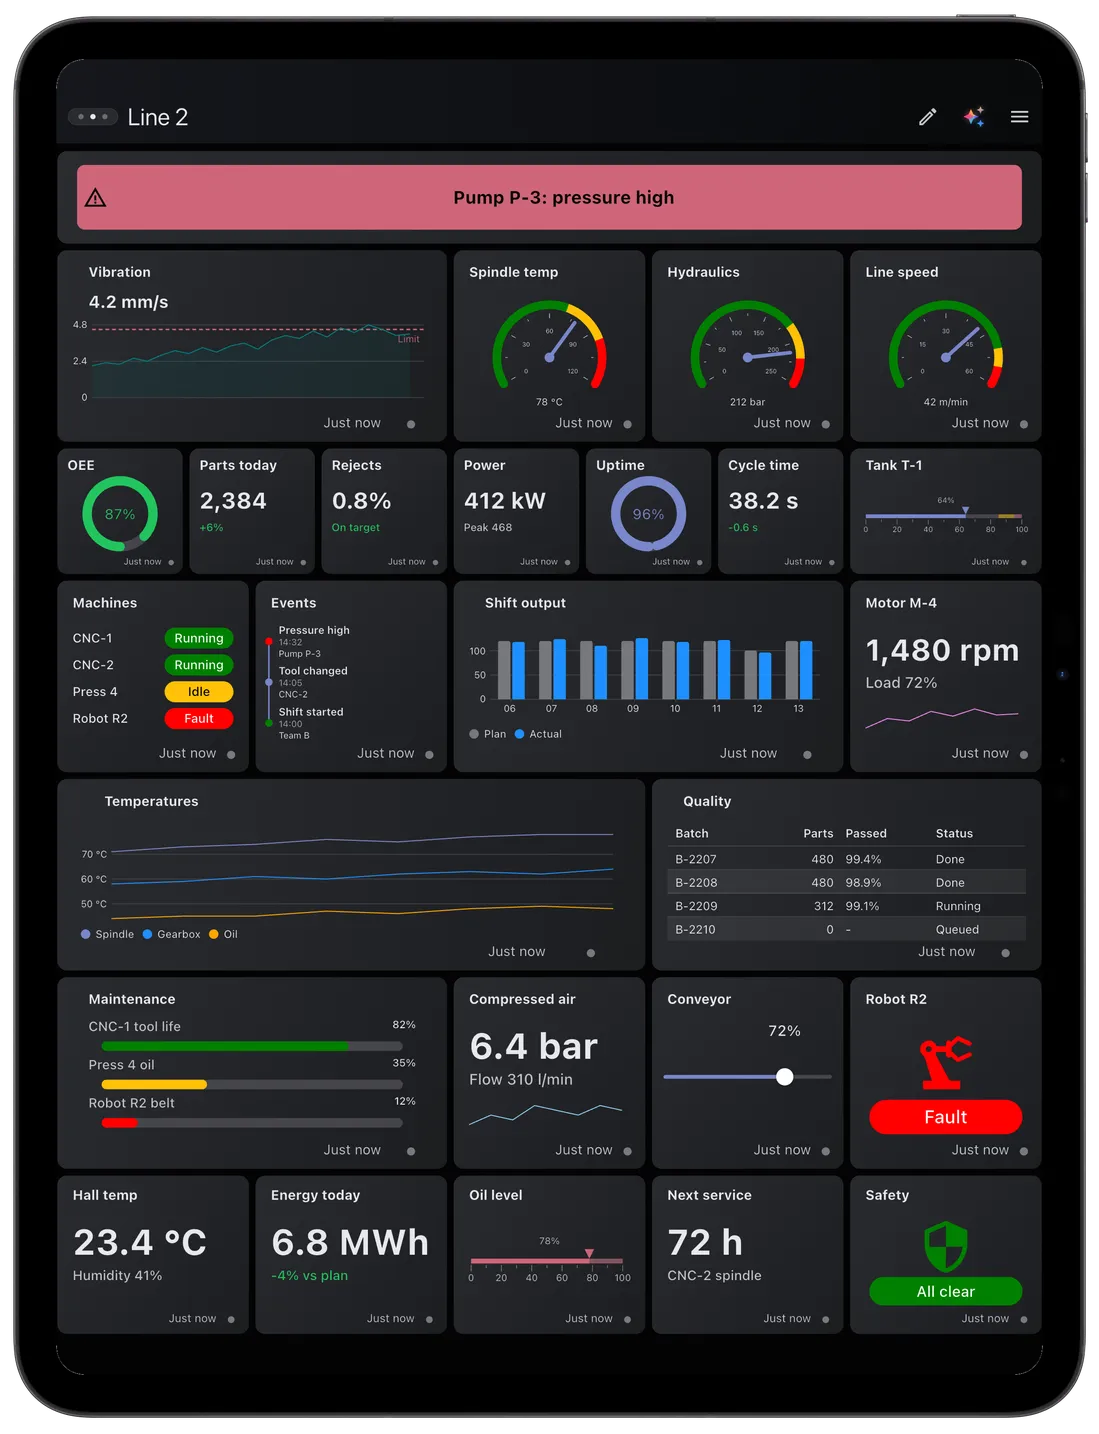
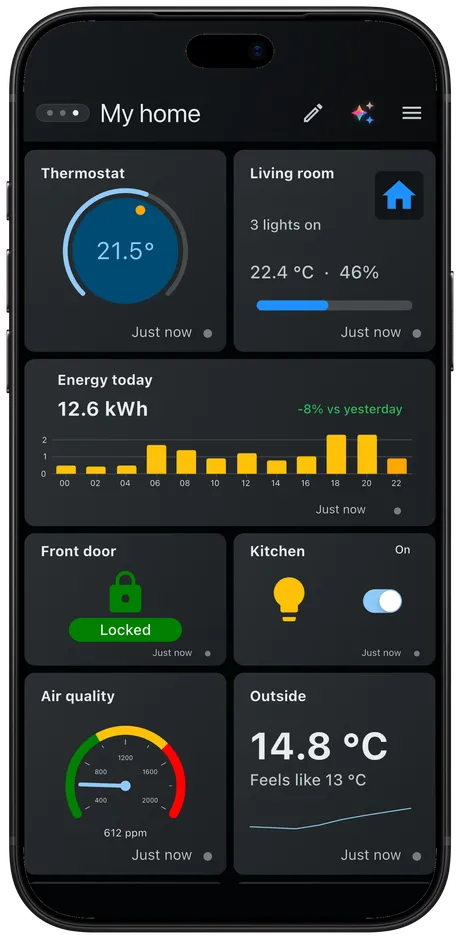
Connect any source
HTTP, MQTT, WebSocket, SSE, HTTP streams, timers and video, side by side in one app.
Monitor and control live data from HTTP, MQTT, WebSocket and SSE. Design every data piece yourself, reshape values with transformers and scripts, and act with a tap.
Free on iPhone and iPad. No account.
An app that turns the data your devices, brokers and APIs already produce into a live dashboard you build yourself, on the device in your hand. Routix Dash is the successor to the MQTT Dash app.
HTTP, MQTT, WebSocket, SSE, HTTP streams, timers and video, side by side in one app.
Each data piece is a small canvas. Place gauges, charts, switches and labels exactly as you want them.
Tap actions send commands back over MQTT, HTTP or WebSocket, run scripts and open links.
Connect HTTP, MQTT, WebSocket or SSE. Data arrives on its own.
Pick the field, convert, compute: JSONPath, an expression or a script.
Bind the value to a gauge, chart or switch you designed yourself.
A tap sends a command back over HTTP, MQTT or WebSocket.
Four things make the difference: the look, the shape of the values, the logic and the control.
Every data piece is yours to design. Open the editor, pick one of the 40+ components in the library, drag and resize it on the canvas, and bind it to a value. Set its properties, such as colors, ranges and labels, and use its events, such as On tap or On change, to run actions.
Incoming data rarely arrives in the shape you want. Chain transformers on a data source, a data piece or a single component: pick a field, convert units, compute a status, format text.
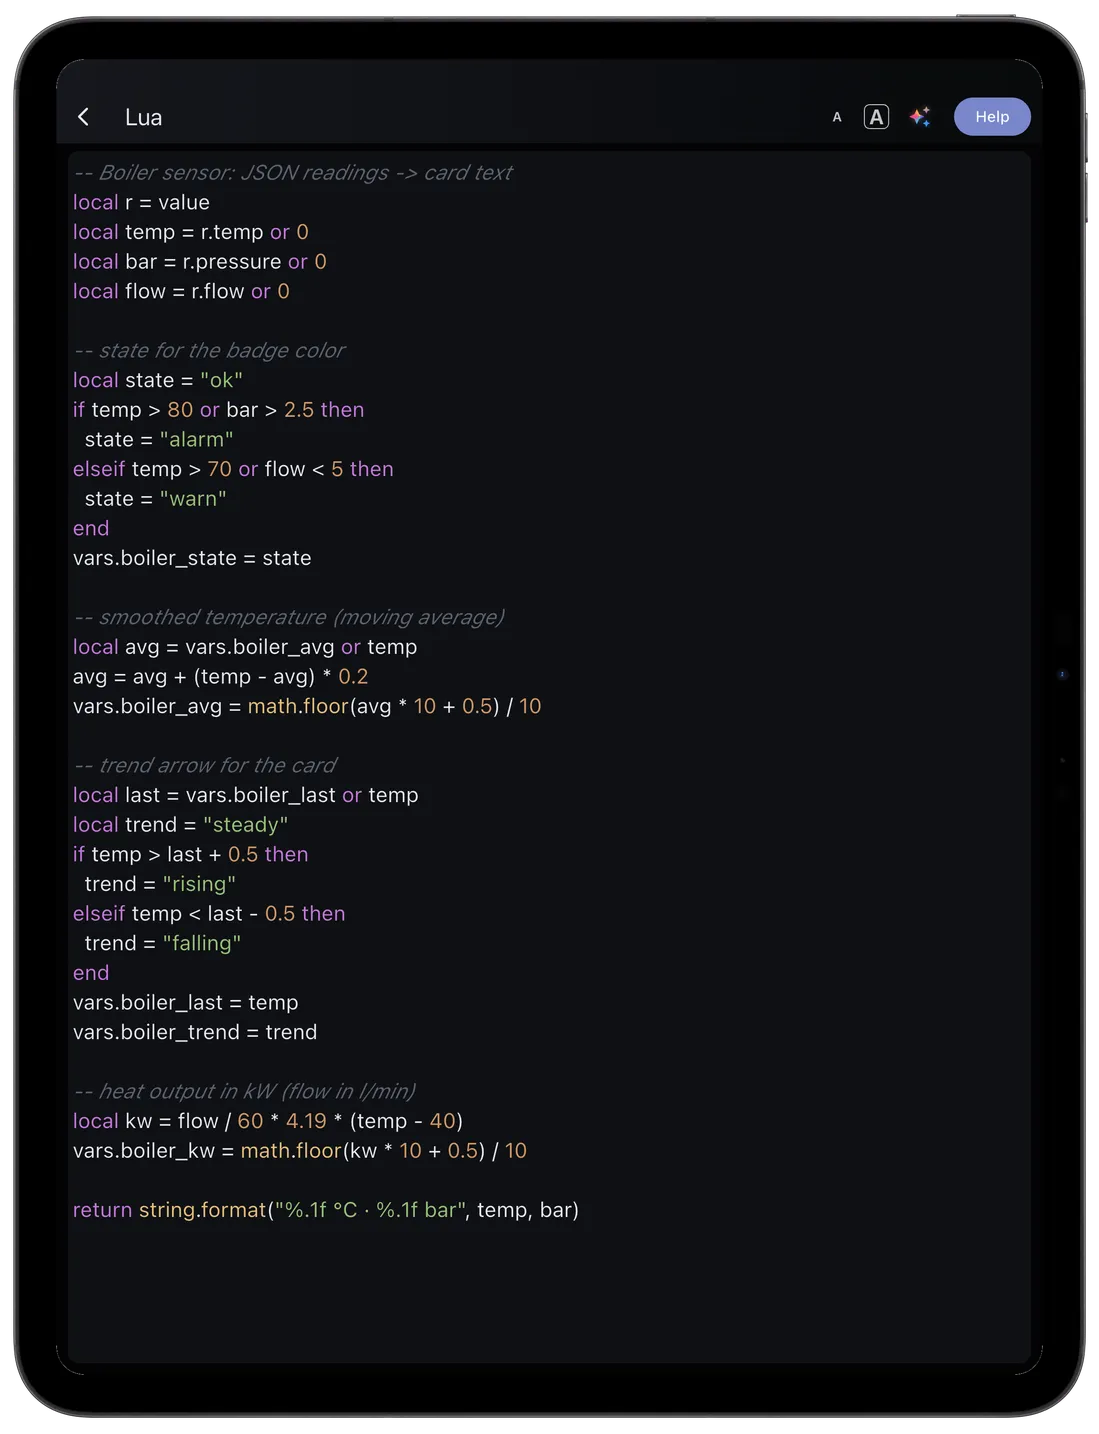
When a transformer is not enough, write a few lines of Lua or JavaScript. Read the incoming value, keep state in variables, and return exactly what the component should show.
Tap actions send data back. A switch publishes to an MQTT topic, a button calls an HTTP endpoint, and a slider sends over WebSocket. Chain several actions and run a script in between.
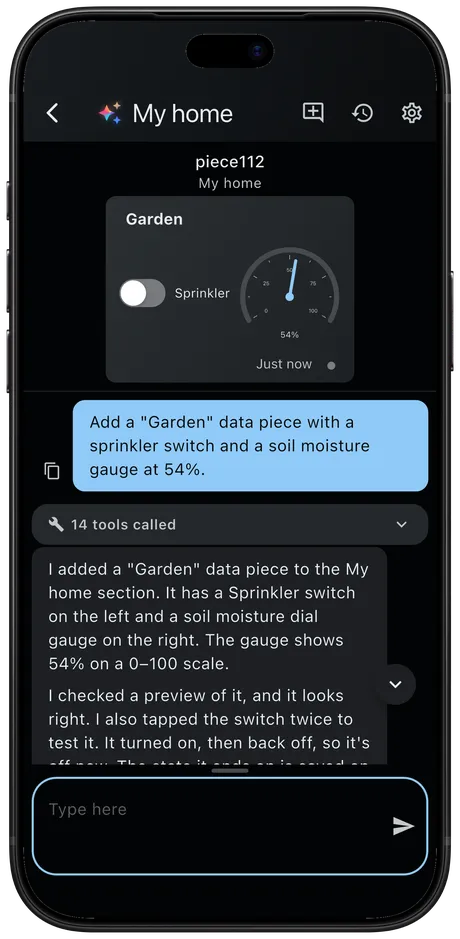
Ask for a data piece and the assistant adds it. Bring your own provider key: requests go from your device straight to the provider.
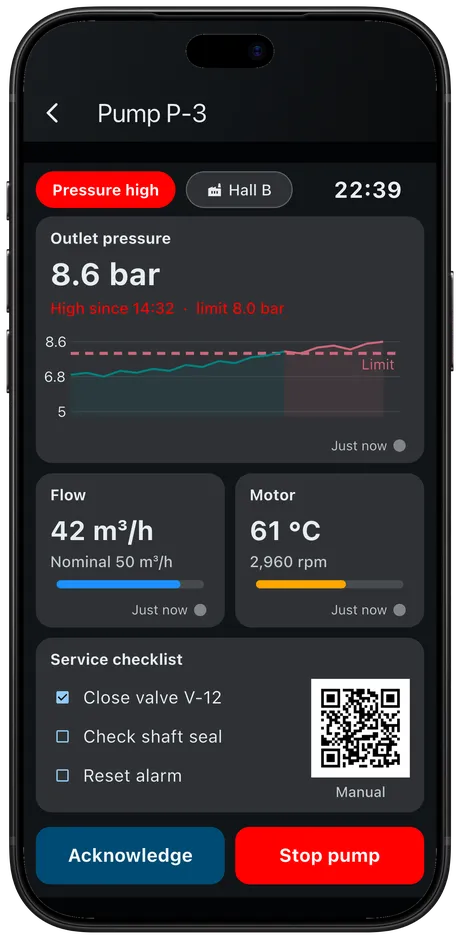
Build full custom screens and bottom sheets from components, and open them from any data piece.
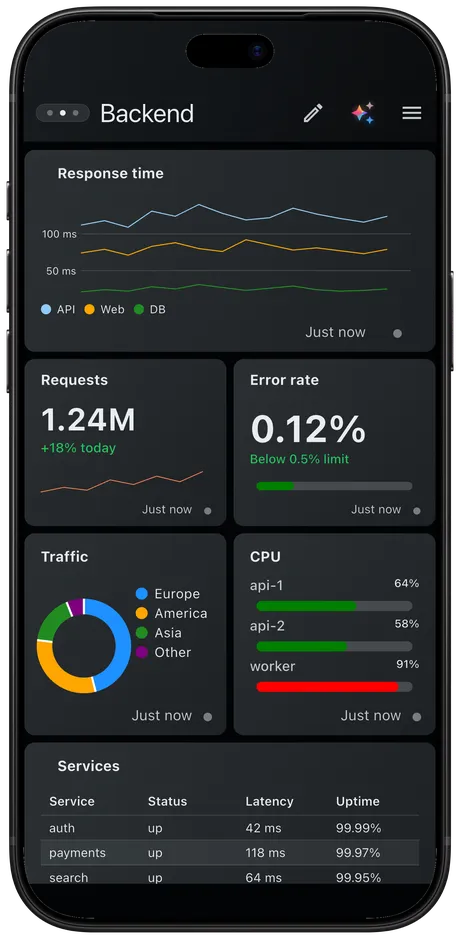
Line, bar and pie charts, data tables, status lists and timelines that update as data comes in.
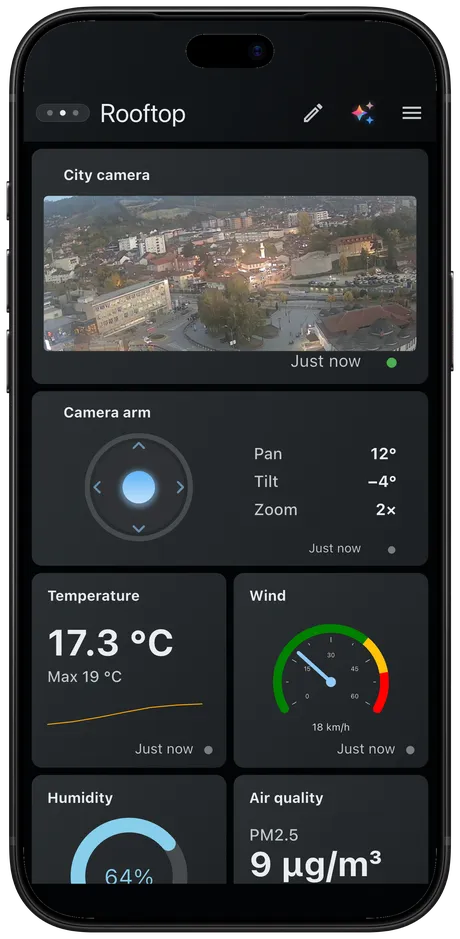
Show a camera stream in a data piece, with pan, tilt and zoom controls right under it.
For iPhone and iPad. Other platforms will follow.